SNMP monitoring with Grafana, Prometheus and snmp_exporter
SNMP monitoring with grafana and prometheus can be done with the official snmp_exporter from prometheus.
Since I didn’t found any direct forward documentation, blog or any source of documentation in an ELI5 style how this will work, this is my try to document my findings and understanding on how this stuff works. To be honest I still don’t understand all stuff inside the generator configuration file but here is what I found out.
Understanding of MIBs and OIDs#
MIBs (Management Information Base) are a collection of OIDs (Object Identifier). Since all OIDs are structured hierarchical they are build like a tree.
SNMP only queries specific OIDs. Imagine MIBs like an menu in an restaurant and the dishes like the OIDs. You can choose from all the menu but you still have to tell the waiter the number of the menu you want to have.
General explaination - snmp_exporter#
The snmp_exporter in general does the snmp queries against the targets you define.
In order to do that it has the snmp.yml configuration file. This configuration file contains what OIDs from which MIBs needs to be queried. It also contains the authentication configuration like community strings or priv/auth password for SNMPv3.
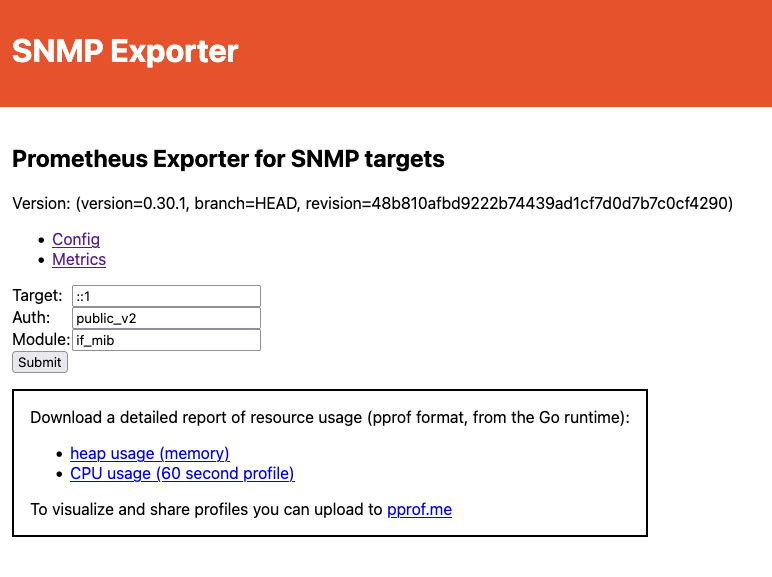
These queried data will be “published” as a website which then the prometheus database can scrape it.
The website can be also be queried manually by yourself. Depending on where you installed the snmp_exporter you can access it via http://localhost:9116.
Generator for snmp.yml#
Since the snmp.yml configuration file can be very long, depending how many OIDs you want to query, you can use the generator in order to let it generate for you. The files for the generator is included in the git repository but you need to compile it yourself. The generator needs a generator.yml configuration file which includes the snmp authentication settings, and which MIBs/OIDs the generator does a snmp walk over in order to add the OIDs to the snmp.yml.
Generator configuration file#
Authentication#
Setting up the authentication is good documented in the configuration file from the Github repository. Just note that you can add multiple authentication methods or even multiple different authentications from the same method. See the following example:
auths:
  cisco-devices:
    version: 3
    community: public
    username: SOME-USER
    security_level: authPriv
    password: <auth-Password>
    auth_protocol: SHA256
    priv_protocol: AES
    priv_password: <priv-Password>
  mikrotik-devices:
    version: 3
    community: public
    username: OTHER-USER
    security_level: authPriv
    password: <auth-Password>
    auth_protocol: SHA256
    priv_protocol: AES
    priv_password: <priv-Password>
Lookups#
Lookups pulls additional lables from the MIB otherwise the interfaces for example are only referred as the index numbers from the ifIndex table. When pulling the labels like ifAlias, ifDescr or ifName you can identify the interface by these labels and not the index numbers.
  if_mib:
    walk:
      - "IF-MIB::ifXTable"
      - "IF-MIB::ifTable" # needed for discards or error since its not included in ifXTable
    lookups:
      - source_indexes: [ifIndex]
        lookup: "IF-MIB::ifAlias"
      - source_indexes: [ifIndex]
        # Disambiguate from PaloAlto PAN-COMMON-MIB::ifDescr.
        lookup: "IF-MIB::ifDescr"
      - source_indexes: [ifIndex]
        # Disambiguate from Netscaler NS-ROOT-MIB::ifName.
        lookup: "IF-MIB::ifName"
    overrides:
      ifAlias:
        ignore: true # Lookup metric
      ifDescr:
        ignore: true # Lookup metric
      ifName:
        ignore: true # Lookup metric
      ifType:
        type: EnumAsInfo
Without labels#
# HELP ifHCInUcastPkts The number of packets, delivered by this sub-layer to a higher (sub-)layer, which were not addressed to a multicast or broadcast address at this sub-layer - 1.3.6.1.2.1.31.1.1.1.7
# TYPE ifHCInUcastPkts counter
ifHCInUcastPkts{ifIndex="1"} 14678
ifHCInUcastPkts{ifIndex="2"} 4
ifHCInUcastPkts{ifIndex="3"} 4
ifHCInUcastPkts{ifIndex="4"} 0
ifHCInUcastPkts{ifIndex="5"} 48818
ifHCInUcastPkts{ifIndex="6"} 0
With labels#
# HELP ifHCInUcastPkts The number of packets, delivered by this sub-layer to a higher (sub-)layer, which were not addressed to a multicast or broadcast address at this sub-layer - 1.3.6.1.2.1.31.1.1.1.7
# TYPE ifHCInUcastPkts counter
ifHCInUcastPkts{ifAlias="enc0",ifDescr="enc0",ifIndex="4",ifName="enc0"} 0
ifHCInUcastPkts{ifAlias="lo0",ifDescr="ALG_LO0",ifIndex="5",ifName="lo0"} 49926
ifHCInUcastPkts{ifAlias="pflog0",ifDescr="pflog0",ifIndex="6",ifName="pflog0"} 0
ifHCInUcastPkts{ifAlias="vio0",ifDescr="ADMIN",ifIndex="1",ifName="vio0"} 15006
ifHCInUcastPkts{ifAlias="vio1",ifDescr="WAN",ifIndex="2",ifName="vio1"} 4
ifHCInUcastPkts{ifAlias="vio2",ifDescr="LAN",ifIndex="3",ifName="vio2"} 4
Workflow#
The following picture shows the workflow of how to generate the snmp.yml and how it integrates in the other processes.

Prometheus scrape job#
The scrape job will be configured inside the prometheus.yml. With these configuration and their parameter a http url will be generated that will be scraped – the website of the snmp_exporter. In this case it will look like this: http://192.168.10.20:9116/snmp?target=192.168.10.150&auth=public_v3&module=if_mib
 - job_name: 'cisco-systems'
    scrape_interval: 1s
    scrape_timeout: 1s
    static_configs:
      - targets:
        - 192.168.10.150  # SNMP device.
    metrics_path: /snmp
    params:
      auth: [public_v3]
      module: [if_mib]
    relabel_configs:
      - source_labels: [__address__]
        target_label: __param_target
      - source_labels: [__param_target]
        target_label: instance
      - target_label: __address__
        replacement: 192.168.10.20:9116
Additionally the scrape intervals determines how often the scrape will be executed. The more often the more precise the data to real time but will put additional load on all systems. Starting with the database itself as well as the device that are being queried.